Everything you need
Nothing more
Statsly is built to answer the questions that actually matter: who visits your site, what they look at, and where they come from?
No cookies, no consent pop-up
We track no personal data. No cookies, no fingerprinting, no cross-site tracking. That means you don't need a cookie banner, and your visitors aren't met with a consent wall on arrival.
- GDPR and ePrivacy compliant out of the box
- No personal data is ever stored
- Your data never leaves the EU
- Tracker script is only 2 KB (gzipped)
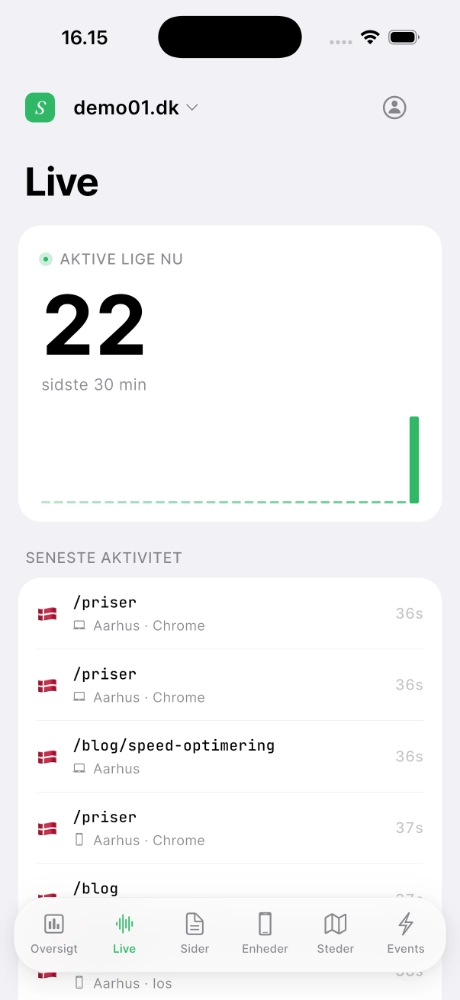
See who's on your site right now
Follow visitors in real time — which pages they're viewing, where they come from, and which device they're on. Refreshes every 5 seconds, on the web and in the mobile app.
- Live visitor count, refreshed every 5 seconds
- Last 30 minutes visualized with spark bars
- Latest activity feed — path, country, device, time
- Works out of the box, no setup
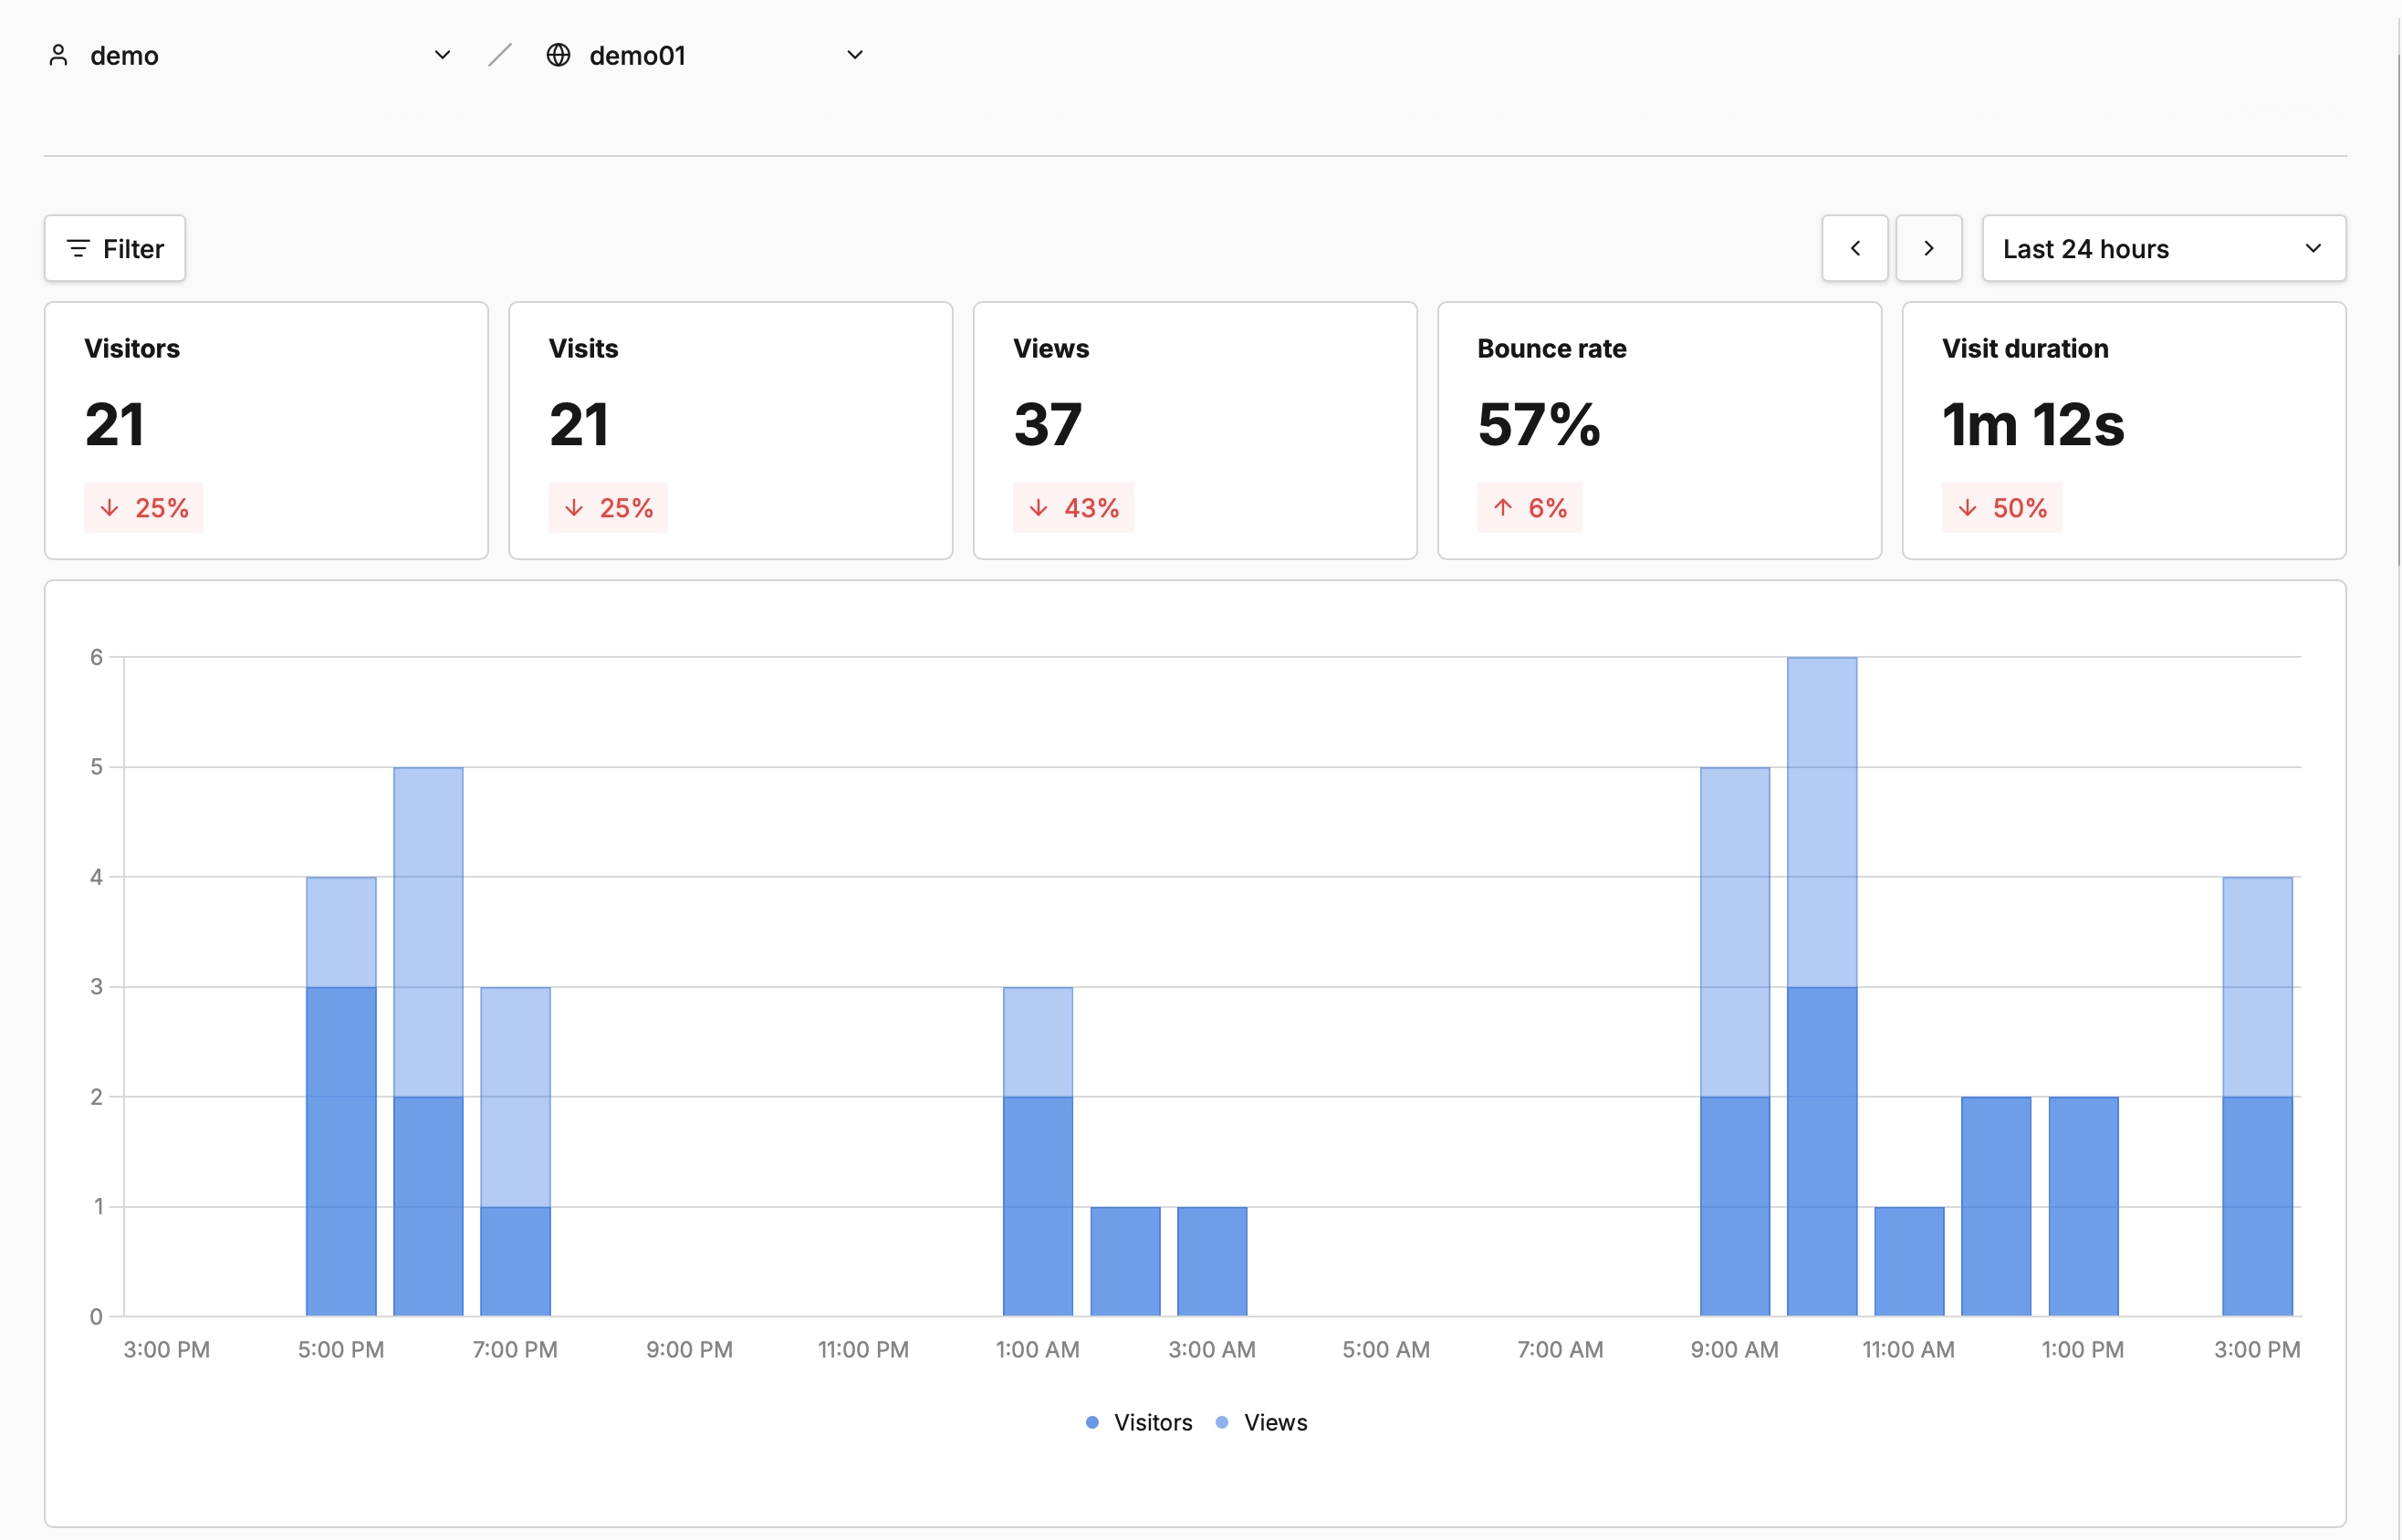
The numbers that matter — and only those
Pageviews, visitors, sessions, bounce rate, average time on site. And a pretty chart. Not a flood of metrics you can't make sense of anyway.
- Pageviews + unique visitors
- Bounce rate & average time on site
- Period comparison (yesterday, last week, etc.)
- Filters on any dimension
What do people read? Where do they come from?
Find out which pages bring in traffic and which channels actually work. Google, LinkedIn, newsletter, or a blog that shared your post — everything is transparent.
- Top pages sorted by views or visitors
- Referrers — social, search engines, direct
- UTM parameters captured and broken down
- Filter by a single campaign or channel
Should you optimize for mobile or desktop?
See the split of your visitors across device types, browsers and operating systems. Perfect for deciding where to put your design effort.
- Device type — desktop, mobile, tablet
- Browser split (Chrome, Safari, Firefox, Edge)
- Operating system breakdown
- Language and screen-resolution data
Countries, cities and regions
See where your visitors come from geographically — down to city level. All inferred from the IP address server-side, and the IP is never stored.
- Countries and cities with flag emojis
- Region split for bigger markets
- IP addresses are never stored
- Language data next to it
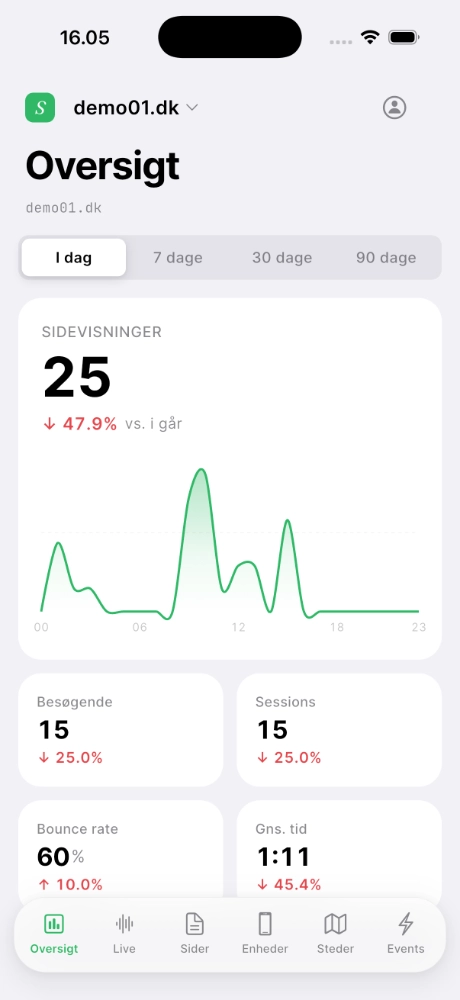
Your analytics, on the go
Native iOS and Android app with all the same data as the dashboard. Live visitor counts, top pages, and latest activity — straight in your pocket.
- Native iOS + Android app
- All 6 screens: Overview, Live, Pages, Devices, Locations, Events
- Light & dark mode + 5 accent colors
- Unlimited websites on one account
Traffic
Everything you need to understand where your visits come from.
Pageviews
Which pages get the most traffic — by views, visitors or time spent.
Visitors
Details per visitor: device, browser, OS and geographic location.
Bounce rate
Which pages keep visitors, and which ones do they leave immediately.
Referrers
Where does traffic come from? Google, LinkedIn, newsletter, direct.
Geography
City, region and country — without storing IP addresses.
Devices
Mobile, desktop, tablet — with browser and OS breakdown.
Languages
What languages your visitors use — so you can prioritize content.
Filters
Slice data by country, browser, URL or any other dimension.
Realtime
See visits and events the second they happen — no lag.
Custom events
Button clicks, form submits, checkouts — with one simple JS call.
Custom data
Your own properties on events: plan tier, order amount, A/B variant.
Performance
Core Web Vitals and load times — keep your site fast for everyone.

Behavior
Patterns and drop-off — not just raw traffic.

Segments
Save filter combinations and reuse them without setting criteria from scratch.
Cohorts
Group users by actions — uncover trends and measure engagement.
Breakdown
Break any metric by dimension and see what's driving the numbers.
Funnels
Track conversion and drop-off rates through your most important flows.
Retention
Measure how often users come back — and whether the product has stickiness.
Goals
Set targets for views or events and track progress toward them.
User journeys
Understand how users navigate through your site.
Revenue
Dig into revenue data and how users spend.
Marketing
Measure campaign impact and see what actually converts.
UTM tracking
Automatic capture of utm_source, utm_medium and the rest.
Trackable links
Short trackable links to measure click performance across campaigns.
Tracking pixels
Embed a pixel in emails or ads — works where JavaScript doesn't.
Compare periods
This month vs. last. Or vs. the same month last year.
Attribution
How users meet your marketing, and what drives conversions.
Channel comparison
Compare performance across organic, paid, social, email and direct.

Collaboration
Share insights with your team and your clients.

Teams
Give team members secure access to specific sites with role-based permissions.
Share reports
Share analytics via a secure, unique URL — perfect for clients without logins.
Email reports
Weekly or monthly reports — compact and easy to read.
Boards
Build custom dashboards with exactly the metrics your team needs.
Audit log
See who changed what on the account and when.
CSV export
Export any report to spreadsheet or your BI tool.
Privacy
Privacy-friendly by default — and compliant with no setup.
GDPR & CCPA
No personal data is ever stored — fully compliant with no configuration.
Anonymization
All visitor data is anonymized to protect your visitors' privacy.
No cookies
We use no cookies — so no annoying cookie banner is required.
Data ownership
You own your data — always. Export whenever you want, or self-host with Umami.
Open source
The Umami core is open source under MIT. All code can be inspected and audited.
Data retention
Decide how long data is kept — and wipe all history with one click.

Cloud
Statsly hosts Umami for you — so you can focus on data.
Fully managed
We handle upgrades, backups and performance tuning.
High performance
Millions or billions of records — the system is built for speed.
Data import
Migrate existing data from Google Analytics, Plausible or Matomo.
Data export
Pull a full dump of your data whenever you want — not just summaries.
Automatic backups
Encrypted daily backups of all data — with point-in-time recovery.
Uptime guarantee
99.9% SLA on both dashboard and tracking endpoint — with status page and history.

Ready to try it?
Create a free account in 30 seconds. No credit card.